| News | ||||||||||||||||||||||||||||||||||||||||||||||||||||||||||||||||||||||||||||||||||||||||||||||||||||||||||||||||||||||||||||||||||||||||||||||||||||||||||||||||||||||||||||||||||||||||||||||||||||||||||||||||||||||||||||||||||||||||||||||||||||||||||||||||||||||||||||||||||||||||||||||||||||||||||||||||||||||||||||||||||||||||||||||||||||||||||||||||
|
|
||||||||||||||||||||||||||||||||||||||||||||||||||||||||||||||||||||||||||||||||||||||||||||||||||||||||||||||||||||||||||||||||||||||||||||||||||||||||||||||||||||||||||||||||||||||||||||||||||||||||||||||||||||||||||||||||||||||||||||||||||||||||||||||||||||||||||||||||||||||||||||||||||||||||||||||||||||||||||||||||||||||||||||||||||||||||||||||||
Historic and Highest Ever Merchandise Export Figures for December - Shri Piyush Goyal |
||||||||||||||||||||||||||||||||||||||||||||||||||||||||||||||||||||||||||||||||||||||||||||||||||||||||||||||||||||||||||||||||||||||||||||||||||||||||||||||||||||||||||||||||||||||||||||||||||||||||||||||||||||||||||||||||||||||||||||||||||||||||||||||||||||||||||||||||||||||||||||||||||||||||||||||||||||||||||||||||||||||||||||||||||||||||||||||||
| 4-1-2022 | ||||||||||||||||||||||||||||||||||||||||||||||||||||||||||||||||||||||||||||||||||||||||||||||||||||||||||||||||||||||||||||||||||||||||||||||||||||||||||||||||||||||||||||||||||||||||||||||||||||||||||||||||||||||||||||||||||||||||||||||||||||||||||||||||||||||||||||||||||||||||||||||||||||||||||||||||||||||||||||||||||||||||||||||||||||||||||||||||
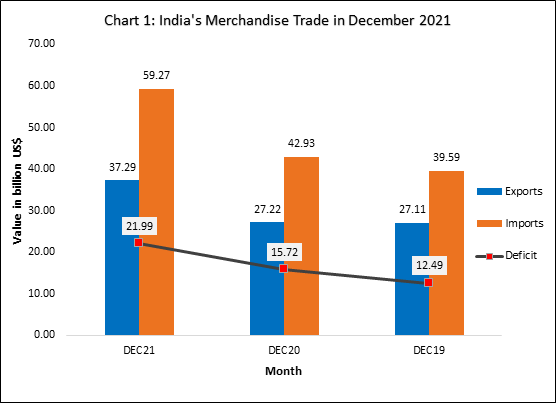
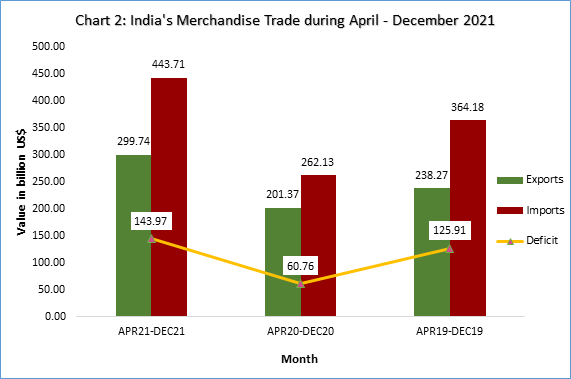
Historic and Highest Ever Merchandise Export Figures for December - Shri Piyush Goyal As per the Preliminary Data for December 2021, India’s merchandise export in December 2021 was USD 37.29 billion, the highest ever monthly achievement, which shows an increase of 37.0% over USD 27.22 billion in December 2020 and an increase of 37.55% over USD 27.11 billion in December 2019. Shri Piyush Goyal, Union Minister for Commerce and Industry, Textiles, Consumer Affairs, Food & Public Distribution called it a historic achievement and attributed it to the leadership of Prime Minister Shri Narendra Modi. He also congratulated all the EPCs, exporters and Indian Embassy officials all across the globe for contributing to this historic achievement. India’s merchandise export in April-December 2021 was USD 299.74 billion, an increase of 48.85% over USD 201.37 billion in April-December 2020 and an increase of 25.80% over USD 238.27 billion in April-December 2019. India’s merchandise import in December 2021 was USD 59.27 billion, an increase of 38.06% over USD 42.93 billion in December 2020 and an increase of 49.7% over USD 39.59 billion in December 2019. India’s merchandise import in April-December 2021 was USD 443.71 billion, an increase of 69.27% over USD 262.13 billion in April-December 2020 and an increase of 21.84% over USD 364.18 billion in April-December 2019. The trade deficit in December 2021 was USD 21.99 billion, while it was 143.97 billion USD during April-December 2021.
Value of non-petroleum exports in December 2021 was 31.67 USD billion, registering a positive growth of 27.31% over non-petroleum exports of USD 24.88 billion in December 2020 and a positive growth of 34.92% over non-petroleum exports of USD 23.48 billion in December 2019. Value of non-petroleum imports was USD 43.37 billion in December 2021 with a positive growth of 30.22% over non-petroleum imports of USD 33.31 billion in December 2020 and a positive growth of 50.20% over non-petroleum imports of USD 28.88 billion in December 2019.
The cumulative value of non-petroleum exports in April-December 2021 was USD 257.14 billion, an increase of 39.82% over USD 183.91 billion in April-December 2020 and an increase of 24.74% over USD 206.13 billion in April-December 2019. The cumulative value of non-petroleum imports in April-December 2021 was USD 325.73 billion, showing an increase of 56.41% compared to non-oil imports of USD 208.25 billion in April-December 2020 and an increase of 21.78% compared to non-oil imports of USD 267.47 billion in April-December 2019.
Value of non-petroleum and non-gems and jewellery exports in December 2021 was USD 28.69 billion, registering a positive growth of 28.64% over non-petroleum and non-gems and jewellery exports of USD 22.30 billion in December 2020 and a positive growth of 36.21% over non-petroleum and non-gems and jewellery exports of USD 21.06 billion in December 2019. Value of non-oil, non-GJ (gold, silver & Precious metals) imports was USD 35.57 billion in December 2021 with a positive growth of 34.68% over non-oil and non-GJ imports of USD 26.41 billion in December 2020 and a positive growth of 47.75% over non-oil and non-GJ imports of USD 24.07 billion in December 2019.
The cumulative value of non-petroleum and non-gems and jewellery exports in April-December 2021 was USD 228.25 billion, an increase of 36.66% over cumulative value of non-petroleum and non-gems and jewellery exports of USD 167.02 billion in April-December 2020 and an increase of 28.12% over cumulative value of non-petroleum and non-gems and jewellery exports of USD 178.15 billion in April-December 2019. Non-oil, non-GJ (Gold, Silver & Precious Metals) imports was USD 263.66 billion in April-December 2021, recording a positive growth of 47.33%, as compared to non-oil and non-GJ imports of USD 178.96 billion in April-December 2020 and a positive growth of 17.20% over USD 224.96 billion in April-December 2019.
Top 10 major commodity groups covering 79% of total exports and showing positive growths in December 2021 over corresponding month of previous year, are –
Top 10 major commodity groups covering 78% of total imports, are –
|
||||||||||||||||||||||||||||||||||||||||||||||||||||||||||||||||||||||||||||||||||||||||||||||||||||||||||||||||||||||||||||||||||||||||||||||||||||||||||||||||||||||||||||||||||||||||||||||||||||||||||||||||||||||||||||||||||||||||||||||||||||||||||||||||||||||||||||||||||||||||||||||||||||||||||||||||||||||||||||||||||||||||||||||||||||||||||||||||