| News | ||||||||||||||||||||||||||||||||||||||||||||||||||||||||||||||||||||||||||||||||||||||||||||||||||||||||||||||||||||||||||||||||||||||||||||||||||||||||||||||||||||||||||||||||||||||||||||||||||||||||||||||||||||||||||||||||||||||||||||||||||||||||||||||||||||||||||||||||||||||||||||||||||||||||||||||||||||||||||||||||||||||||||||||||||||||||||||||||
|
|
||||||||||||||||||||||||||||||||||||||||||||||||||||||||||||||||||||||||||||||||||||||||||||||||||||||||||||||||||||||||||||||||||||||||||||||||||||||||||||||||||||||||||||||||||||||||||||||||||||||||||||||||||||||||||||||||||||||||||||||||||||||||||||||||||||||||||||||||||||||||||||||||||||||||||||||||||||||||||||||||||||||||||||||||||||||||||||||||
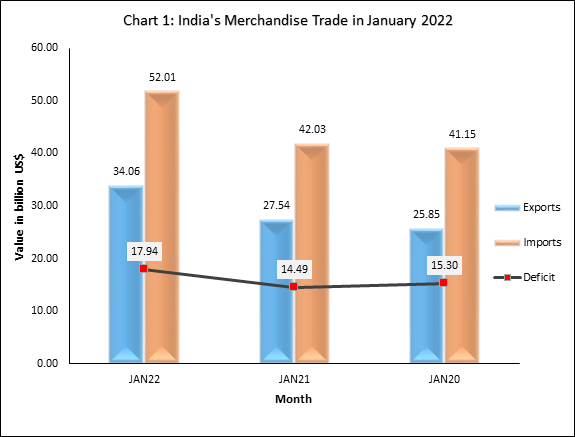
India’s merchandise export in January 2022 increases by 23.69% to USD 34.06 billion over USD 27.54 billion in January 2021; records increase of 31.75% over USD 25.85 billion in January 2020 |
||||||||||||||||||||||||||||||||||||||||||||||||||||||||||||||||||||||||||||||||||||||||||||||||||||||||||||||||||||||||||||||||||||||||||||||||||||||||||||||||||||||||||||||||||||||||||||||||||||||||||||||||||||||||||||||||||||||||||||||||||||||||||||||||||||||||||||||||||||||||||||||||||||||||||||||||||||||||||||||||||||||||||||||||||||||||||||||||
| 2-2-2022 | ||||||||||||||||||||||||||||||||||||||||||||||||||||||||||||||||||||||||||||||||||||||||||||||||||||||||||||||||||||||||||||||||||||||||||||||||||||||||||||||||||||||||||||||||||||||||||||||||||||||||||||||||||||||||||||||||||||||||||||||||||||||||||||||||||||||||||||||||||||||||||||||||||||||||||||||||||||||||||||||||||||||||||||||||||||||||||||||||
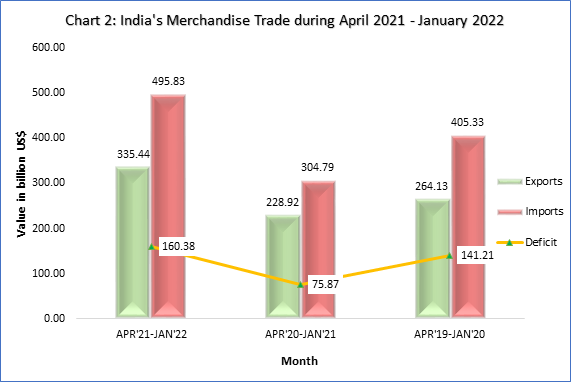
India’s merchandise export in January 2022 increases by 23.69% to USD 34.06 billion over USD 27.54 billion in January 2021; records increase of 31.75% over USD 25.85 billion in January 2020 India’s merchandise import in January 2022 was USD 52.01 billion, an increase of 23.74% over USD 42.03 billion in January 2021 and an increase of 26.38% over USD 41.15 billion in January 2020. India’s merchandise import in 2021-22 (April-January) was USD 495.83 billion, an increase of 62.68% over USD 304.79 billion in 2020-21 (April-January) and an increase of 22.3% over USD 405.33 billion in 2019-20 (April-January). The trade deficit in January 2022 was USD 17.94 billion, while it was 160.38 billion USD during 2021-22 (April-January).
Value of non-petroleum exports in January 2022 was 30.33 USD billion, registering a positive growth of 19.4% over non-petroleum exports of USD 25.4 billion in January 2021 and a positive growth of 33.81% over non-petroleum exports of USD 22.67 billion in January 2020. Value of non-petroleum imports was USD 40.57 billion in January 2022 with a positive growth of 24.44% over non-petroleum imports of USD 32.61 billion in January 2021 and a positive growth of 44.19% over non-petroleum imports of USD 28.14 billion in January 2020.
The cumulative value of non-petroleum exports in 2021-22 (Apr-Jan) was USD 287.84 billion, an increase of 37.59% over USD 209.19 billion in 2020-21 (Apr-Jan) and an increase of 25.8% over USD 228.8 billion in 2019-20 (Apr-Jan). The cumulative value of non-petroleum imports in 2021-22 (Apr-Jan) was USD 366.14 billion, showing an increase of 51.67% compared to non-oil imports of USD 241.41 billion in 2020-21 (Apr-Jan) and an increase of 23.86% compared to non-oil imports of USD 295.61 billion in 2019-20 (Apr-Jan).
Value of non-petroleum and non-gems and jewellery exports in January 2022 was USD 27.09 billion, registering a positive growth of 20.1% over non-petroleum and non-gems and jewellery exports of USD 22.56 billion in January 2021 and a positive growth of 36.92% over non-petroleum and non-gems and jewellery exports of USD 19.79 billion in January 2020. Value of non-oil, non-GJ (gold, silver & Precious metals) imports was USD 35.22 billion in January 2022 with a positive growth of 33.6%over non-oil and non-GJ imports of USD 26.36 billion in January 2021and a positive growth of 41.63% over non-oil and non-GJ imports of USD 24.87 billion in January 2020.
The cumulative value of non-petroleum and non-gems and jewellery exports in 2021-22 (April-January) was USD 255.69 billion, an increase of 34.95% over cumulative value of non-petroleum and non-gems and jewellery exports of USD 189.47 billion in 2020-21(April-January) and an increase of 29.18% over cumulative value of non-petroleum and non-gems and jewellery exports of USD 197.94 billion in 2019-20 (April-January). Non-oil, non-GJ (Gold, Silver & Precious Metals) imports was USD 298.65 billion in 2021-22 (April-January), recording a positive growth of 45.06%, as compared to non-oil and non-GJ imports of USD 205.88 billion in 2020-21(April-January) and a positive growth of 19.54% over USD 249.83 billion in 2019-20 (April-January).
Top 10 major commodity groups covering 78% of total exports in January 2022,are –
Top 10 major commodity groups covering 75% of total imports in January 2022, are –
|
||||||||||||||||||||||||||||||||||||||||||||||||||||||||||||||||||||||||||||||||||||||||||||||||||||||||||||||||||||||||||||||||||||||||||||||||||||||||||||||||||||||||||||||||||||||||||||||||||||||||||||||||||||||||||||||||||||||||||||||||||||||||||||||||||||||||||||||||||||||||||||||||||||||||||||||||||||||||||||||||||||||||||||||||||||||||||||||||