India’s overall exports in April 2023 estimated at USD 65.02 billion; a positive growth of 2 percent.
Electronic goods, Rice, Drugs and Pharmaceuticals, Oil meals, Ceramic products and glassware and Spices registered significant increase in exports in April 2023
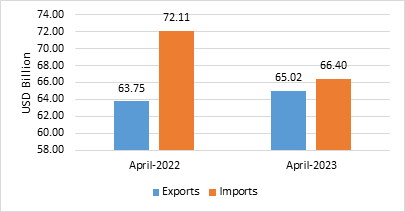
- India’s overall exports (Merchandise and Services combined) in April 2023* is estimated to be USD 65.02 Billion, exhibiting a positive growth of 2.00 per cent over April 2022. Overall imports in April 2023* is estimated to be USD 66.40 Billion, exhibiting a negative growth of (-) 7.92 per cent over April 2022.
Table 1: Trade during April 2023*
|
|
|
April 2023
(USD Billion)
|
April 2022
(USD Billion)
|
|
Merchandise
|
Exports
|
34.66
|
39.70
|
|
Imports
|
49.90
|
58.06
|
|
Services*
|
Exports
|
30.36
|
24.05
|
|
Imports
|
16.50
|
14.06
|
|
Overall Trade
(Merchandise +Services) *
|
Exports
|
65.02
|
63.75
|
|
Imports
|
66.40
|
72.11
|
|
Trade Balance
|
-1.38
|
-8.37
|
* Note: The latest data for services sector released by RBI is for March 2023. The data for April 2023 is an estimation, which will be revised based on RBI’s subsequent release. (ii) Data for April 2022 has been revised on pro-rata basis using quarterly balance of payments data.
Fig 1: Overall Trade during April 2023*
MERCHANDISE TRADE
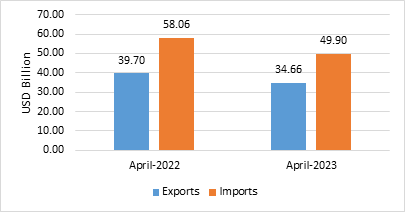
- Merchandise exports in April 2023 were USD 34.66 Billion, as compared to USD 39.70 Billion in April 2022.
- Merchandise imports in April 2023 were USD 49.90 Billion, as compared to USD 58.06 Billion in April 2022.
Fig 2: Merchandise Trade during April 2023
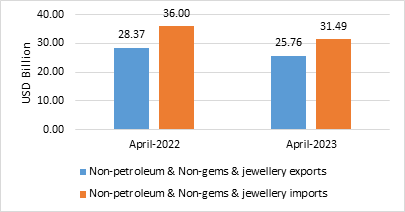
- Non-petroleum and non-gems & jewellery exports in April 2023 were USD 25.76 Billion, compared to USD 28.37 Billion in April 2022.
- Non-petroleum, non-gems & jewellery (gold, silver & precious metals) imports in April 2023 were USD 31.49 Billion, compared to USD 36.00 Billion in April 2022.
Table 2: Trade excluding Petroleum and Gems & Jewellery during April 2023
|
|
April 2023
(USD Billion)
|
April 2022
(USD Billion)
|
|
Non- petroleum exports
|
28.19
|
31.84
|
|
Non- petroleum imports
|
34.72
|
40.42
|
|
Non-petroleum & Non Gems & Jewellery exports
|
25.76
|
28.37
|
|
Non-petroleum & Non Gems & Jewellery imports
|
31.49
|
36.00
|
Note: Gems &Jewellery Imports include Gold, Silver & Pearls, precious & Semi-precious stones
Fig 3: Trade excluding Petroleum and Gems & Jewellery during April 2023
SERVICES TRADE
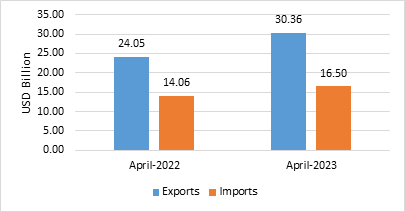
- The estimated value of services export for April 2023* is USD 30.36 Billion, as compared to USD 24.05 Billion in April 2022.
- The estimated value of services import for April 2023* is USD 16.50 Billion as compared to USD 14.06 Billion in April 2022.
Fig 4: Services Trade during April 2023*
- Riding on the high exports base of April 2022 India’s overall exports is projected to grow at 2 percent during April 2023.
- Under merchandise exports, 11 of the 30 key sectors exhibited positive growth in April 2023 as compared to the same period last year (April 2022). These include Oil Meals (95.14%), Electronic Goods (26.49%), Rice (24.01%), Oil Seeds (18.01%), Ceramic Products & Glassware (17.21%), Spices (14.44%), Drugs & Pharmaceuticals (10.45%), Fruits & Vegetables (9.96%), Tobacco (6.28%), Coffee (4.17%) and Cereal Preparations & Miscellaneous Processed Items (2.03%).
- Exports of Electronic goods increased by 26.49 percent during April 2023 at USD 2.11 Billion as compared to USD 1.67 Billion in April 2022.
- Textiles, Plastic & Linoleum exports continued to decline in April 2023 because of subdued demand due to recessionary effects in major economies.
- Under merchandise imports, 23 out of 30 key sectors exhibited negative growth in April 2023. These include Project Goods (-73.05%), Sulphur & Unroasted Iron Pyrites (-62.03%), Fertilisers, Crude & Manufactured (-45.86%), Gold (-41.48%), Vegetable Oil (-37.74%), Organic & Inorganic Chemicals (-31.36%), Metaliferrous Ores & Other Minerals (-28.93%), Coal, Coke & Briquettes, Etc. (-28.51%), Leather & Leather Products (-26.32%), Pearls, Precious & Semi-Precious Stones (-18.73%), Medicinal & Pharmaceutical Products (-18.33%), Textile Yarn Fabric, Made-Up Articles (-17.06%), Fruits & Vegetables (-16.87%), Transport Equipment (-14.89%), Petroleum, Crude & Products (-13.95%), Cotton Raw & Waste (-13.81%), Dyeing/Tanning/Colouring Materials. (-8.17%), Artificial Resins, Plastic Materials, etc. (-6.12%), Wood & Wood Products (-5.92%), Electronic Goods (-5.67%), Non-Ferrous Metals (-5.24%), Chemical Material & Products (-4.59%) and Newsprint (-2.9%).
- Services exports remain robust and projected to grow at 26.24 percent during April 2023 over April 2022.
* Link for Quick Estimates