Overall trade deficit during April-November improves by 38.79 percent from USD 100.38 Billion in 2022 to USD 61.44 Billion in 2023; merchandise trade deficit also improves from USD 189.21 Billion in April-November 2022 to USD 166.35 Billion in April-November 2023
Major contributors to export growth in November 2023 include Iron Ore, Gems & Jewellery, Drugs & Pharmaceuticals, Fruits & Vegetables, Meat, Dairy & Poultry Products, Mica, Coal & Other Ores, Minerals Including Processed Minerals and Cotton Yarn/ Fabs. /Made-Ups, Handloom Products Etc
Electronic goods exports register a growth of 23.56 percent at USD 17.74 Billion during April-November 2023 as compared to USD 14.36 Billion in April-November 2022
Ceramic products & glassware exports record a growth of 20.90 percent from USD 2.42 Billion in April-November 2022 to USD 2.93 Billion in April-November2023
Drugs and pharma exports grew by 8.05 percent in April-November 2023 at USD 17.92 Billion from USD 16.59 Billion in April-November 2022
Agricultural exports continue to grow in November 2023: Fruits & Vegetables (31.14%), Meat, Dairy & Poultry Products (19.91%), Oil Meals (17.22%), Spices (11.3%), Coffee (11%) and Cereal Preparations & Miscellaneous Processed Items (5.9%)
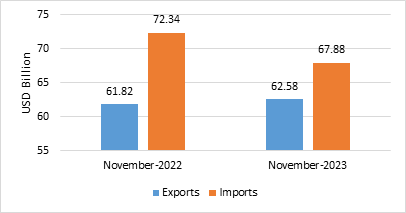
- India’s overall exports (Merchandise and Services combined) in November 2023* is estimated to be USD 62.58 Billion, exhibiting a positive growth of 1.23 per cent over November 2022. Overall imports in November 2023* is estimated to be USD 67.88 Billion, exhibiting a negative growth of (-) 6.16 per cent over November 2022.
Table 1: Trade during November 2023*
|
|
|
November 2023
(USD Billion)
|
November 2022
(USD Billion)
|
|
Merchandise
|
Exports
|
33.90
|
34.89
|
|
Imports
|
54.48
|
56.95
|
|
Services*
|
Exports
|
28.69
|
26.93
|
|
Imports
|
13.40
|
15.39
|
|
Overall Trade
(Merchandise +Services) *
|
Exports
|
62.58
|
61.82
|
|
Imports
|
67.88
|
72.34
|
|
Trade Balance
|
-5.30
|
-10.52
|
* Note: The latest data for services sector released by RBI is for October 2023. The data for November 2023 is an estimation, which will be revised based on RBI’s subsequent release. (ii) Data for April-November 2022 and April-June 2023 has been revised on pro-rata basis using quarterly balance of payments data.
Fig 1: Overall Trade during November 2023*
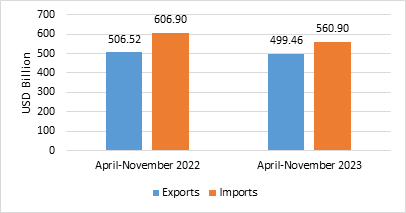
- India’s overall exports (Merchandise and Services combined) in April-November 2023* are estimated to be USD 499.46 Billion, exhibiting a negative growth of (-) 1.39 per cent over April-November 2022. Overall imports in April-November 2023* are estimated to be USD 560.90 Billion, exhibiting a negative growth of (-) 7.58 per cent over April-November 2022.
Table 2: Trade during April-November 2023*
|
|
|
April-November 2023
(USD Billion)
|
April-November 2022
(USD Billion)
|
|
Merchandise
|
Exports
|
278.80
|
298.21
|
|
Imports
|
445.15
|
487.42
|
|
Services*
|
Exports
|
220.66
|
208.30
|
|
Imports
|
115.75
|
119.48
|
|
Overall Trade
(Merchandise+ Services)*
|
Exports
|
499.46
|
506.52
|
|
Imports
|
560.90
|
606.90
|
|
Trade Balance
|
-61.44
|
-100.38
|
Fig 2: Overall Trade during April-November 2023*
MERCHANDISE TRADE
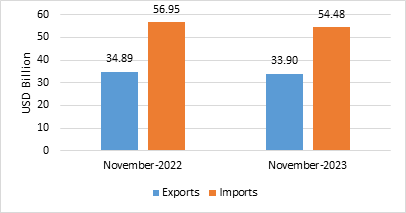
- Merchandise exports in November 2023 were USD 33.90 Billion, as compared to USD 34.89 Billion in November 2022.
- Merchandise imports in November 2023 were USD 54.48 Billion, as compared to USD 56.95 Billion in November 2022.
Fig 3: Merchandise Trade during November 2023
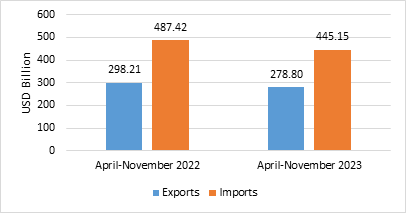
- Merchandise exports for the period April-November 2023 were USD 278.80 Billion as against USD 298.21 Billion during April-November 2022.
- Merchandise imports for the period April-November 2023 were USD 445.15 Billion as against USD 487.42 Billion during April-November 2022.
- The merchandise trade deficit for April-November 2023 was estimated at USD 166.35 Billion as against USD 189.21 Billion during April-November 2022.
Fig 4: Merchandise Trade during April-November 2023
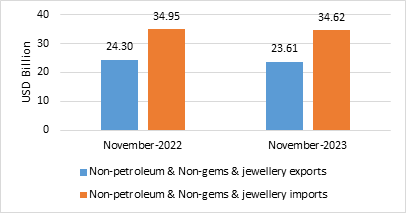
- Non-petroleum and non-gems & jewellery exports in November 2023 were USD 23.61 Billion, compared to USD 24.30 Billion in November 2022.
- Non-petroleum, non-gems & jewellery (gold, silver & precious metals) imports in November 2023 were USD 34.62 Billion, compared to USD 34.95 Billion in November 2022.
Table 3: Trade excluding Petroleum and Gems & Jewellery during November 2023
|
|
November 2023
(USD Billion)
|
November 2022
(USD Billion)
|
|
Non- petroleum exports
|
26.41
|
26.80
|
|
Non- petroleum imports
|
39.55
|
40.63
|
|
Non-petroleum & Non Gems & Jewellery exports
|
23.61
|
24.30
|
|
Non-petroleum & Non Gems & Jewellery imports
|
34.62
|
34.95
|
Note: Gems & Jewellery Imports include Gold, Silver & Pearls, precious & Semi-precious stones
Fig 5: Trade excluding Petroleum and Gems & Jewellery during November 2023
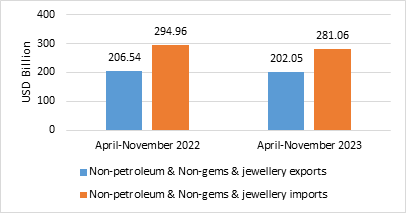
- Non- petroleum and non-gems & jewellery exports during April-November 2023 was USD 202.05 Billion, as compared to USD 206.54 Billion in April-November 2022.
- Non-petroleum, non-gems & jewellery (gold, silver & precious metals) imports were USD 281.06 Billion in April-November 2023 as compared to USD 294.96 Billion in April-November 2022.
Table 4: Trade excluding Petroleum and Gems & Jewellery during April-November 2023
|
|
April-November 2023
(USD Billion)
|
April-November 2022
(USD Billion)
|
|
Non- petroleum exports
|
223.46
|
232.99
|
|
Non- petroleum imports
|
331.50
|
348.13
|
|
Non-petroleum & Non Gems & Jewellery exports
|
202.05
|
206.54
|
|
Non-petroleum & Non Gems & Jewellery imports
|
281.06
|
294.96
|
Note: Gems & Jewellery Imports include Gold, Silver & Pearls, precious & Semi-precious stones
Fig 6: Trade excluding Petroleum and Gems & Jewellery during April-November 2023
SERVICES TRADE
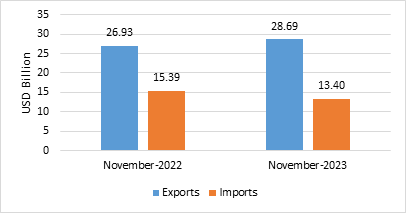
- The estimated value of services export for November 2023* is USD 28.69 Billion, as compared to USD 26.93 Billion in November 2022.
- The estimated value of services import for November 2023* is USD 13.40 Billion as compared to USD 15.39 Billion in November 2022.
Fig 7: Services Trade during November 2023*
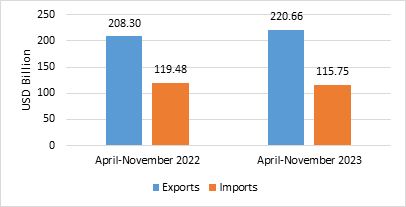
- The estimated value of services export for April-November 2023* is USD 220.66 Billion as compared to USD 208.30 Billion in April-November 2022.
- The estimated value of services imports for April-November 2023* is USD 115.75 Billion as compared to USD 119.48 Billion in April-November 2022.
- The services trade surplus for April-November 2023* is estimated at USD 104.91 Billion as against USD 88.83 Billion in April-November 2022.
Fig 8: Services Trade during April-November 2023*
- For the month of November 2023, under merchandise exports, 15 of the 30 key sectors exhibited positive growth in November 2023 as compared to same period last year (November 2022). These include Iron Ore (2207.38%), Fruits & Vegetables (31.14%), Meat, Dairy & Poultry Products (19.91%), Oil Meals (17.22%), Mica, Coal & Other Ores, Minerals Including Processed Minerals (16.62%), Gems & Jewellery (11.97%), Spices (11.3%), Coffee (11%), Drugs & Pharmaceuticals (7.33%), Cotton Yarn/ Fabs. /Made-Ups, Handloom Products Etc. (6.33%), Cereal Preparations & Miscellaneous Processed Items (5.9%), Carpet (4.22%), Ceramic Products & Glassware (2.17%), Handicrafts Excl. Hand Made Carpet (1.17%) and Electronic Goods (1.09%).
- Under merchandise imports, 15 out of 30 key sectors exhibited negative growth in November 2023. These include Pearls, Precious & Semi-Precious Stones (-56.71%), Fertilisers, Crude & Manufactured (-38.91%), Cotton Raw & Waste (-37.4%), Vegetable Oil (-37.24%), Newsprint (-31.92%), Pulp And Waste Paper (-24.41%), Transport Equipment (-18.58%), Organic & Inorganic Chemicals (-16.54%), Wood & Wood Products (-14.5%), Chemical Material & Products (-10.58%), Coal, Coke & Briquettes, Etc. (-10.39%), Petroleum, Crude & Products (-8.47%), Textile Yarn Fabric, Made-Up Articles (-7.54%), Artificial Resins, Plastic Materials, Etc. (-5.57%) and Sulphur & Unroasted Iron Pyrites (-4.62%).
- For April-November 2023, under merchandise exports, 14 of the 30 key sectors exhibited positive growth during April-November 2023 as compared to April-November 2022. These include Iron Ore (203.93%), Oil Meals (34.33%), Electronic Goods (23.56%), Ceramic Products & Glassware (20.9%), Fruits & Vegetables (15.1%), Tobacco (10.44%), Oil Seeds (9.56%), Drugs & Pharmaceuticals (8.05%), Meat, Dairy & Poultry Products (6.31%), Cereal Preparations & Miscellaneous Processed Items (6.27%), Cotton Yarn/Fabs./Made-Ups, Handloom Products Etc. (5.72%), Coffee (4.72%), Spices (3.34%) and Cashew (0.3%).
- Under merchandise imports, 16 of the 30 key sectors exhibited negative growth in April-November 2023 as compared to April-November 2022. These include Cotton Raw & Waste (-63.97%), Silver (-53.8%), Fertilisers, Crude & Manufactured (-36.34%), Sulphur & Unroasted Iron Pyrts (-35.92%), Coal, Coke & Briquettes, Etc. (-30.6%), Pearls, Precious & Semi-Precious Stones (-27.59%), Vegetable Oil (-26.26%), Organic & Inorganic Chemicals (-21.6%), Petroleum, Crude & Products (-18.41%), Textile Yarn Fabric, Made-Up Articles (-15.57%), Transport Equipment (-13.86%), Wood & Wood Products (-12.6%), Newsprint (-11.26%), Leather & Leather Products (-9.33%), Pulp And Waste Paper (-8.73%) and Artificial Resins, Plastic Materials, Etc. (-4.55%).
- Services exports is projected to grow positively at 5.93 percent during April-November 2023 over April-November2022.
- India’s trade deficit has shown considerable improvement in April-November 2023. Overall trade deficit for April-November 2023* is estimated at USD 61.44 Billion as compared to the deficit of USD 100.38 Billion during April-November 2022, registering a decline of (-) 38.79 percent. The merchandise trade deficit during April-November 2023 is USD 166.35 Billion compared to USD 189.21 Billion during April-November 2022, registering a decline of (-) 12.08 percent.