| News | ||||||||||||||||||||||||||||||||||||||||||||||||||||||||||||||||||||||||||||||||||||||||||||||||||||||||||||||||||||||||||||||||||||||||||||||||||||||||||||||||||||||||||||||||
|
|
||||||||||||||||||||||||||||||||||||||||||||||||||||||||||||||||||||||||||||||||||||||||||||||||||||||||||||||||||||||||||||||||||||||||||||||||||||||||||||||||||||||||||||||||
Interest Rates and Economic Activity (Speech by Shri Deepak Mohanty, Executive Director, Reserve Bank of India, delivered to the Association of Financial Professionals of India (AFPI), Pune, August 23, 2013) |
||||||||||||||||||||||||||||||||||||||||||||||||||||||||||||||||||||||||||||||||||||||||||||||||||||||||||||||||||||||||||||||||||||||||||||||||||||||||||||||||||||||||||||||||
| 24-8-2013 | ||||||||||||||||||||||||||||||||||||||||||||||||||||||||||||||||||||||||||||||||||||||||||||||||||||||||||||||||||||||||||||||||||||||||||||||||||||||||||||||||||||||||||||||||
I thank Ms. Preeta Misra, Director & Member Secretary, Association of Financial Professionals of India (AFPI) for this opportunity to interact with distinguished professionals of corporate India. In the recent period, there has been an animated debate on the role of interest rates in influencing real economic activities. In particular, the discussion has been on how a change in policy interest rate impacts the lending rates, and thereby industrial performance and overall economic activity. In this context, the last decade through 2012-13 has been eventful with rapid changes in the monetary policy stance responding to the evolving growth-inflation dynamics. This is a period in which we recorded one of our highest output growth rate as also one of the lowest. Inflation showed significant variation. We also experienced the global financial crisis, the adverse effects of which are still lingering. As you know, Indian economy is currently passing through a very challenging phase: growth has slowed; though wholesale price inflation has come down consumer price inflation remains close to double digits, and financial market volatility has increased. A major factor in the recent growth slowdown is a significant deceleration in private corporate investment. Since you are the key professionals taking investment decisions, I thought it will be relevant to discuss how does monetary policy decisions, through interest rate changes, affect investment decisions and thus economic activity? Another motivation for this subject is that colleagues in the Reserve Bank have done substantial research in this area and a paper entitled “Real Interest Rate Impact on Investment and Growth: What the Empirical Evidence for India Suggests?” was placed in the public domain. I will urge you to look at that paper so that it generates further research and discussion. Against this background, my presentation will be as follows: I will briefly review the stance of monetary policy and economic outcome during the last decade through 2012-13; discuss monetary transmission with a focus on the interest rate channel; and examine the impact of interest rate changes on economic activity both at the macro and micro levels. Changes in monetary stance In the last 10-year period from 2003-04 to 2012-13, monetary policy response can be broadly categorised into four phases based on growth-inflation outcome and the rapidly changing monetary policy response:
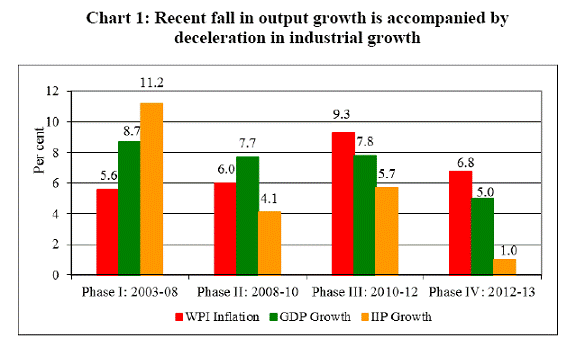
Monetary policy stance in any particular phase is generally conditioned by the growth-inflation balance, the outlook for growth-inflation in a forward looking context and an assessment of macroeconomic risks. Essentially, monetary policy aims at attaining high growth in a non-inflationary manner. But at times high growth in excess of potential growth could trigger inflation putting the sustainability of the very growth path to risks. Hence, monetary policy tends to do a careful balancing act so that it is not too accommodative of growth in excess of its potential and at the same time not too stimulative of inflation. However, there could be periods of rising inflation and falling growth below its potential. This could arise from several sources such as the lagged impact of policy stimulus from earlier phases and adverse supply shocks, both domestic and external, which persist. The challenge of rebalancing growth and inflation is evident from the four phases of growth-inflation presented in Table 1 and Chart 1. In the first phase, high growth coincided with low inflation. However, towards the latter part of the period as inflationary pressures rose it warranted monetary tightening. In the second phase, reflecting the impact of global financial crisis, growth decelerated and weak commodity prices globally and relatively stable exchange rate contained inflation. That created the space for monetary easing. In the third phase, India recovered ahead of the global economy, and actual growth in 2010-11 at 9.3 per cent exceeded significantly the post-crisis estimated potential growth of 7.5-8.0 per cent. With a sharp recovery in growth, inflation too caught up rapidly, partly complicated by a rebound in global commodity prices. The anti-inflationary thrust of monetary policy became unavoidable to contain inflation and anchor inflationary expectations.
In the fourth phase, softening of inflation created space for monetary easing. However, growth is yet to pick up reflecting both weak global demand, domestic supply constraints and slowdown in corporate investment. In this context, the role of monetary policy has also come to the fore: the question being to what extent monetary policy has played a role in the growth slowdown? Let me try to address this issue. Monetary policy transmission While there is considerable attention even to small changes in policy interest rate, the question is: does this really matter? The response to this question lies in an assessment of how does this policy rate changes affect market rates, particularly the cost of credit, and ultimately impacts the investment and consumption decisions of economic entities. Apart from market rates, expectations about future outcomes play an important role. There could also be transmission lags. Moreover, the magnitude of change in market interest rates may be different, ranging from money market rates to lending rates. While policy rate changes do matter, it is not that straight forward as to how they impact lending rates in the transmission chain. In this context, how policy rate changes, impact bank deposit rates become important as banks rely on cost plus pricing of their loan products. Apart from cost of deposits, banks also load a risk premium which may change in different phases of the business cycle, and therefore, the lags could be longer. Hence, how fast the banks are able to change these parameters would largely determine the changes in their lending rates. Thus, nominal lending rate determination in the market is a complex process, and how changes in lending rates impact overall growth is even more uncertain. This is the reason why monetary policy transmission is often dubbed as a “black box”. Hence, explaining monetary transmission is a constant challenge for every central bank. Let me now turn to the issue of transmission of monetary policy in India. In the last few years, there have been several empirical studies, examining the interest rate channel of monetary transmission. The general conclusion from these studies is that increases in policy rate have a statistically significant negative impact on output and moderating impact on inflation. However, the negative effect of a policy rate increase is first felt on output before the moderating impact on inflation. The lags in policy rate changes on output are 2-3 quarters and on inflation 3-4 quarters. The total impact on policy change could, however, linger for 8-10 quarters. A notable feature of monetary policy transmission in India is the asymmetry one observes during different phases of a monetary policy cycle. Usually, during a phase of rising policy rate, banks may be quick in raising their lending rates while in a phase of falling policy rate, banks may be slow in reducing their lending rates as cost of deposits does not adjust commensurately given the fixed nature of deposit contracts. This pattern reflects that loans, being mostly at variable rates, can be re-priced at a quicker pace than the fixed rate bank deposits. The asymmetric transmission also needs to be seen in relation to overall liquidity conditions. For example, in a tight liquidity condition, even if the policy rate is reduced banks may not be in a position to reduce deposit rates and hence lending rates with the apprehension of losing deposits. There could be other considerations for not lowering deposit rates if rates of return in competing products such as small savings and mutual funds are more attractive. Another consideration in a falling interest rate scenario could be that banks might want to protect their profit margin through a more sluggish adjustment of their lending rates. Notwithstanding various complexities, the interest rate channel of monetary transmission has been evident over the monetary policy cycles in the recent years. The policy interest rate changes did impact the market interest rate in the same direction, though at varying intensity. The magnitude of changes in lending rates, however, more closely followed the changes in deposit rates (Table 2).
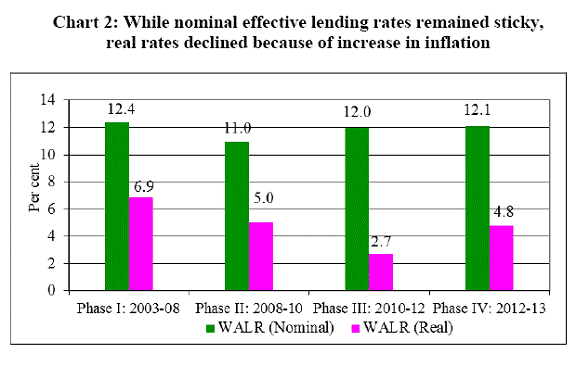
Nominal or real interest rate? Another aspect of monetary transmission is whether it is the nominal interest rate or the real interest rate that can influence growth and investment. In the literature, the stance of monetary policy is judged as loose or tight depending on the level of real policy rate. Most economists believe that it is the real interest rate that could influence real economic activity. However, as individuals and corporates we take economic decisions looking at the nominal rates as these are the rates that we can observe. Is it that these are two distinct concepts? I do not think so. Notwithstanding apparent differences, is it not that at the back of our mind there is no inflation metric while planning an investment project, howsoever different it may be for different entities? Is it not a fact that a negative real interest rate favours debtors whereas a positive interest rate favours creditors? The link between the real interest rate and nominal interest rate is provided by the famous Fisher equation which postulates that the nominal interest rate is the sum total of a real interest rate and expected inflation. One implication of this is that the nominal interest rates should move in tandem with inflation. In the real world, nominal interest rates may not change one for one with the inflation rate but the direction more often is similar. Countries with higher inflation tend to have higher nominal interest rates than countries with lower inflation. Accordingly, the nominal interest rates in advanced countries tend to be lower than in emerging market and developing countries. While the notion of a real interest rate poses conceptual difficulties, the compilation of a real lending rate is even more difficult. It involves two steps: first to compute an effective nominal lending rate, and second to deflate it with an appropriate inflation metric. In our context, while the base rates of banks generally provide the floor to their lending rates actual borrower specific lending rates are different. Estimates of weighted average lending rate (WALR) of banks both in nominal and real terms are presented in Chart 2. The real rates are obtained by deflating the nominal rates by the annual average wholesale price inflation.
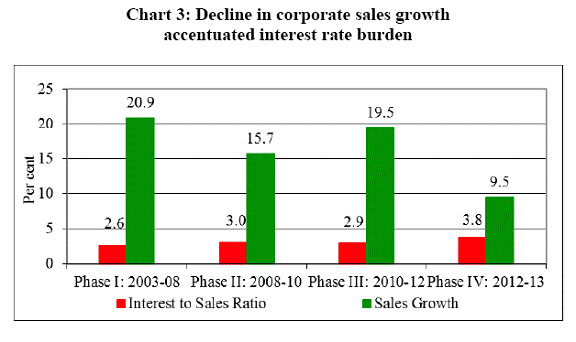
During the period of the high growth phase of 2003-08, WALR of all scheduled commercial banks stood at 12.4 per cent, which dropped to 11.0 per cent during the crisis period of 2008-10. Subsequently, it went up and has remained around 12 per cent thereafter (Chart 3). WALR in real terms declined sharply from 6.9 per cent in the high growth phase of 2003-08 to 5.0 per cent in the crises period of 2008-10. It fell further to 2.7 per cent during 2010-12 period and then went up to 4.8 per cent in the subsequent period. Despite stickiness in the nominal interest rate, the reduction in the real rate was higher as inflation on an average turned out to be higher. However, in 2012-13 as inflation showed a significant moderation the real lending rate has risen. Why did the investment growth slacken despite moderation in real lending rates? In this context, let me now turn to micro-level corporate finance data of a fairly large diversified sample. The analysis shows that interest cost as a ratio of sales went up from 2.6 per cent in the high growth phase of 2003-08 to over 3 per cent during the crisis period of 2008-10. However, during this period the average sales growth declined from about 21 per cent per annum to 15.7 per cent. Following subsequent recovery to 19.5 per cent per annum, it has plummeted to 9.5 per cent in 2012-13. Consequently interest cost to sales ratio rose to 3.8 per cent. It will thus seem that deceleration in sales growth has accentuated the interest burden on the corporates at the micro level. The Reserve Bank study I cited earlier suggests that for 100 basis point increase in real interest rate, investment rate may decline by 50 basis points and real GDP growth may moderate by 20 basis points. As indeed the real interest rate has moderated in the post-crisis period, it should not have had a large negative impact on investment, but for significant deterioration in the prospects of return on investment driven by non-monetary factors.
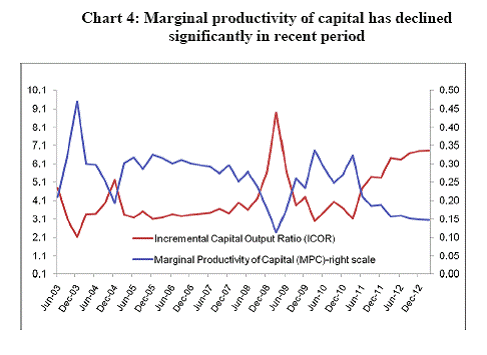
Decline in Marginal Efficiency of Capital In this context, let me turn to the investment decision at the firm level. This is an area in where you are better informed than me. At the firm level, investment decisions may be driven by a comparison of the internal rate of return (IRR) with the hurdle rate. As long as interest rate is lower than IRR, additional investment may continue. While IRR is seen in nominal terms, marginal efficiency of capital (MEC) which is measured in real terms plays an important role. In a phase of sustained slowdown in economic growth, non-monetary factors may lower MEC faster than the extent to which interest rate may decline. As a result, despite a lower interest rate, investment may not pick up. The fall in IRR could be driven by adverse shocks to cash flows and deterioration in macroeconomic conditions. At the macroeconomic level supply bottlenecks and sluggish demand can depress MEC, which can more than offset the beneficial impact of a lower lending rate on investment and growth. The incremental capital output ratio (ICOR) has been rising in India in the last four years since 2008-09. The implicit marginal productivity of capital (MPC), which is the inverse of ICOR, accordingly has been declining (Chart 4).
Conclusion Let me conclude. The Reserve Bank has been traversing a growth-inflation knife edge in recent years. The sluggish growth conditions in the last two years and the dampened investment activities warranted a shift in the stance of monetary policy. The extent of monetary policy easing, however, has been circumscribed by the persisting risks to inflation and the external balance position. Price stability and exchange rate stability are necessary preconditions to sustainable high growth. Furthermore, when non-monetary factors are impeding a robust revival in growth, lower real or nominal interest rates may not be just enough to stimulate growth. |
||||||||||||||||||||||||||||||||||||||||||||||||||||||||||||||||||||||||||||||||||||||||||||||||||||||||||||||||||||||||||||||||||||||||||||||||||||||||||||||||||||||||||||||||