Trade deficit improved by 28.26% during April to June 2023 to US$ 22.59 Billion from US$ 31.49 Billion in April to June 2022
Merchandise Trade Deficit also improves by 7.9% at USD 57.6 Billion April-June 2023 as compared to USD 62.6 Billion in April-June 2022
Electronic Goods export witnessed impressive growth of 45.4 % and 47.1% in June 2023 and April-June 2023 respectively over corresponding period last year
Iron Ore exports show significant increase of 1664.3% in June 2023 as compared to June 2022, and 35 % during April-June 2023 over April-June 2022
Agricultural exports register robust growth; Spices by 18.2% while exports of Fruits and Vegetables by 14.1% Oil Seeds by 25.1%, Oil Meals by 33.2% in April-June 2023 over April-June 2022
Drugs and pharma export registered 5.13% and 5.10% growth in both June 2023 and April to June 2023 respectively as compared to same period last year
Handicrafts excluding Hand Made Carpet export registered growth of 5.14% in June 2023 as compared to June 2022
India’s overall exports (Merchandise and Services combined) in June 2023* is estimated to be USD 60.09 Billion, exhibiting a negative growth of (-) 13.16 per cent over June 2022. Overall imports in June 2023* is estimated to be USD 68.98 Billion, exhibiting a negative growth of (-) 13.91 per cent over June 2022.
Table 1: Trade during June 2023*
|
|
|
June 2023
(USD Billion)
|
June 2022
(USD Billion)
|
|
Merchandise
|
Exports
|
32.97
|
42.28
|
|
Imports
|
53.10
|
64.35
|
|
Services*
|
Exports
|
27.12
|
26.92
|
|
Imports
|
15.88
|
15.77
|
|
Overall Trade
(Merchandise +Services) *
|
Exports
|
60.09
|
69.20
|
|
Imports
|
68.98
|
80.12
|
|
Trade Balance
|
-8.89
|
-10.92
|
* Note: The latest data for services sector released by RBI is for May 2023. The data for June 2023 is an estimation, which will be revised based on RBI’s subsequent release. (ii) Data for April-June 2022 has been revised on pro-rata basis using quarterly balance of payments data.

- India’s overall exports (Merchandise and Services combined) in April-June 2023 is estimated to exhibit a negative growth of (-) 7.29 per cent over April-June 2022. Overall imports in April-June 2023 is estimated to exhibit a negative growth of (-) 10.18 per cent over April-June 2022.
Table 2: Trade during April-June 2023*
|
|
|
April-June 2023
(USD Billion)
|
April-June 2022
(USD Billion)
|
|
Merchandise
|
Exports
|
102.68
|
120.98
|
|
Imports
|
160.28
|
183.54
|
|
Services*
|
Exports
|
80.03
|
76.09
|
|
Imports
|
45.01
|
45.02
|
|
Overall Trade (Merchandise+Services) *
|
Exports
|
182.70
|
197.08
|
|
Imports
|
205.29
|
228.56
|
|
Trade Balance
|
-22.59
|
-31.49
|

MERCHANDISE TRADE
- Merchandise exports in June 2023 were USD 32.97 Billion, as compared to USD 42.28 Billion in June 2022.
- Merchandise imports in June 2023 were USD 53.10 Billion, as compared to USD 64.35 Billion in June 2022.

- Merchandise exports for the period April-June 2023 were USD 102.68 Billion as against USD 120.98 Billion during April-June 2022.
- Merchandise imports for the period April-June 2023 were USD 160.28 Billion as against USD 183.54 Billion during April-June 2022.
- The merchandise trade deficit for April-June 2023 was estimated at USD 57.60 Billion as against USD 62.55 Billion during April-June 2022.

- Non-petroleum and non-gems & jewellery exports in June 2023 were USD 25.13 Billion, compared to USD 28.15 Billion in June 2022.
- Non-petroleum, non-gems & jewellery (gold, silver & precious metals) imports in June 2023 were USD 33.28 Billion, compared to USD 38.93 Billion in June 2022.
Table 3: Trade excluding Petroleum and Gems & Jewellery during June 2023
|
|
June 2023
(USD Billion)
|
June 2022
(USD Billion)
|
|
Non- petroleum exports
|
27.41
|
31.69
|
|
Non- petroleum imports
|
40.56
|
45.42
|
|
Non-petroleum & Non Gems & Jewellery exports
|
25.13
|
28.15
|
|
Non-petroleum & Non Gems & Jewellery imports
|
33.28
|
38.93
|
Note: Gems &Jewellery Imports include Gold, Silver & Pearls, precious & Semi-precious stones

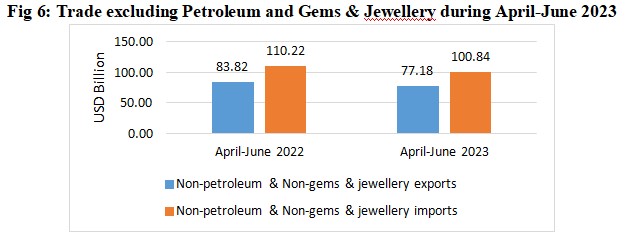
- Non-petroleum and non-gems & jewellery exports during April-June 2023 was USD 77.18 Billion, as compared to USD 83.82 Billion in April-June 2022.
- Non-petroleum, non-gems & jewellery (gold, silver & precious metals) imports were USD 100.84 Billion in April-June 2023 as compared to USD 110.22 Billion in April-June 2022.
Table 4: Trade excluding Petroleum and Gems & Jewellery during April-June 2023
|
|
April-June 2023
(USD Billion)
|
April-June 2022
(USD Billion)
|
|
Non- petroleum exports
|
84.71
|
94.05
|
|
Non- petroleum imports
|
116.94
|
130.35
|
|
Non-petroleum & Non Gems & Jewellery exports
|
77.18
|
83.82
|
|
Non-petroleum & Non Gems & Jewellery imports
|
100.84
|
110.22
|
Note: Gems &Jewellery Imports include Gold, Silver & Pearls, precious & Semi-precious stones
SERVICES TRADE
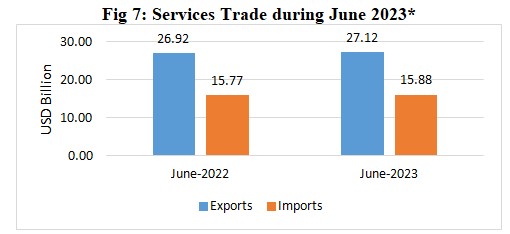
- The estimated value of services export for June 2023* is USD 27.12 Billion, as compared to USD 26.92 Billion in June 2022.
- The estimated value of services import for June 2023* is USD 15.88 Billion as compared to USD 15.77 Billion in June 2022.
- The estimated value of services export for April-June 2023* is USD 80.03 Billion as compared to USD 76.09 Billion in April-June 2022.
- The estimated value of services imports for April-June 2023* is USD 45.01 Billion as compared to USD 45.02 Billion in April-June 2022.
- The services trade surplus for April-June 2023* is estimated at USD 35.02 Billion as against USD 31.07 Billion in April-June 2022.

- India’s trade performance, after witnessing very high growth in 2022-23 has shown declining trends as compared to high base of last year in the backdrop of global slowdown. As per the World Bank Global Economic Prospects report (June 2023) the global economy is set to slow substantially in 2023, to 2.1 percent, after growing at 3.1% last year.
- For the month of June 2023, under merchandise exports, 9 of the 30 key sectors exhibited positive growth in June 2023 as compared to same period last year (June 2022). These include Iron Ore (1664.3%), Electronic Goods (45.36%), Oil Seeds (33.33%), Cashew (19.6%), Tobacco (17.8%), Fruits & Vegetables (14.1%), Coffee (7.1%), Handicrafts Excl. Hand Made Carpet (5.14%) and Drugs & Pharmaceuticals (5.13%).
- Exports of Electronic goods increased by 45.36 percent during June 2023 at USD 2.43 Billion as compared to USD 1.67 Billion in June 2022. During April-June 2023 electronic goods exports were recorded at USD 6.96 Billion as compared to USD 4.73 Billion during April-June 2022, registering a growth of 47.05 percent.
- Enabling policies facilitating greater investment in electronics, mobile manufacturing, pharmaceuticals, etc. has resulted in visible growth in these sectors.
- Textiles exports continued to decline in June 2023 because of subdued demand due to recessionary effects in major economies.
- Under merchandise imports, 21 out of 30 key sectors exhibited negative growth in June 2023. These include Silver (-94.36%), Coal, Coke & Briquettes, Etc. (-47.61%), Sulphur & Unroasted Iron Pyrites (-35.64%), Petroleum, Crude & Products (-33.77%), Textile Yarn Fabric, Made-Up Articles (-33.72%), Organic & Inorganic Chemicals (-30.53%), Wood & Wood Products (-28.83%), Vegetable Oil (-28.18%), Artificial Resins, Plastic Materials, Etc. (-25.99%), Dyeing/Tanning/Colouring Materials (-25.55%), Pearls, Precious & Semi-Precious Stones (-24.46%), Cotton Raw & Waste (-24.27%), Fruits & Vegetables (-18.04%), Metaliferrous Ores & Other Minerals (-16.99%), Fertilisers, Crude & Manufactured (-8.6%), Medicinal & Pharmaceutical Products (-5.41%), Machine Tools (-5.36%), Pulp And Waste Paper (-4.3%), Non-Ferrous Metals (-3.51%), Machinery, Electrical & Non-Electrical (-2.19%) and Transport Equipment (-1.57%).
- For April-June 2023, under merchandise exports, 11 of the 30 key sectors exhibited positive growth during April-June 2023 as compared to April-June 2022. These include Electronic Goods (47.05%), Iron Ore (35.01%), Oil Meals (33.15%), Oil Seeds (25.13%), Spices (18.24%), Fruits & Vegetables (14.12%), Ceramic Products & Glassware (9.47%), Tobacco (7.45%), Drugs & Pharmaceuticals (5.1%), Coffee (4.32%) and Rice (3.63%).
- Under merchandise imports, 20 of the 30 key sectors exhibited negative growth in April-June 2023 as compared to April-June 2022. These include Silver (-86.25%), Sulphur & Unroasted Iron Pyrites (-58.36%), Vegetable Oil (-32.9%), Coal, Coke & Briquettes, Etc. (-32.45%), Cotton Raw & Waste (-27.72%), Organic & Inorganic Chemicals (-27.68%), Pearls, Precious & Semi-Precious Stones (-25.04%), Project Goods (-21.93%), Textile Yarn Fabric, Made-Up Articles (-21.81%), Petroleum, Crude & Products (-18.52%), Metaliferrous Ores & Other Minerals (-14.38%), Artificial Resins, Plastic Materials, Etc. (-14.17%), Wood & Wood Products (-13.42%), Fertilisers, Crude & Manufactured (-12.03%), Fruits & Vegetables (-10.56%), Dyeing/Tanning/Colouring Materials (-10.41%), Medicinal & Pharmaceutical Products (-7.67%), Gold (-7.54%), Transport Equipment (-6.37%), Leather & Leather Products (-4.02%).
- Silver imports slumped by 94.36 percent from USD 0.79 Billion in June 2022 to USD 0.04 Billion in June 2023.
- Services exports is projected to continue to grow positively at 5.17 percent during April-June 2023 over April-June 2022.
- India’s trade deficit has shown considerable decline in April-June 2023. Overall trade deficit for April-June 2023* is estimated at USD 22.59 Billion as compared to the deficit of USD 31.49 Billion during April-June 2022, registering a decline of (-) 28.27 percent. The merchandise trade deficit during April-June 2023 was USD 57.60 Billion compared to USD 62.55 Billion during April-June 2022, registering a decline of (-) 7.92 percent.
Click here to view the Quick Estimates June 2023
|